Tired of manually pulling analytics every Monday? This walkthrough shows you how to build an n8n workflow that automatically fetches your Google Analytics data, compares it week-over-week, and posts a rich summary card to Google Chat. Every Monday at 9 AM, hands-free.
What the Workflow Does
Every Monday morning, this workflow:
- Pulls this week's GA4 metrics (users, sessions, page views, bounce rate, engagement rate)
- Pulls the previous week's metrics for comparison
- Grabs your top 5 traffic sources
- Merges all three data streams together
- Runs JavaScript to calculate percentage changes and build a rich card
- Posts the card to Google Chat via webhook
                      ┌─────────────────┐
                 ┌───►│ GA4 This Week   │───┐
                 │    └─────────────────┘   │
┌──────────┐    │    ┌─────────────────┐   │    ┌───────┐    ┌────────────────┐    ┌──────────────┐
│ Weekly   │────┼───►│ GA4 Last Week   │───┼───►│ Merge │───►│ Build Chat Card│───►│ HTTP Request │
│ Schedule │    │    └─────────────────┘   │    └───────┘    └────────────────┘    │ (Chat API)   │
│ Mon 9 AM │    │    ┌─────────────────┐   │                                      └──────────────┘
└──────────┘    └───►│ GA4 Top Sources │───┘
                     └─────────────────┘
The workflow has 7 nodes total. Let's walk through each one.
Before you start, make sure you have: an n8n instance running (cloud or self-hosted), a GA4 property with traffic data, Google Analytics OAuth2 credentials configured in n8n, and a Google Chat space with a webhook URL.
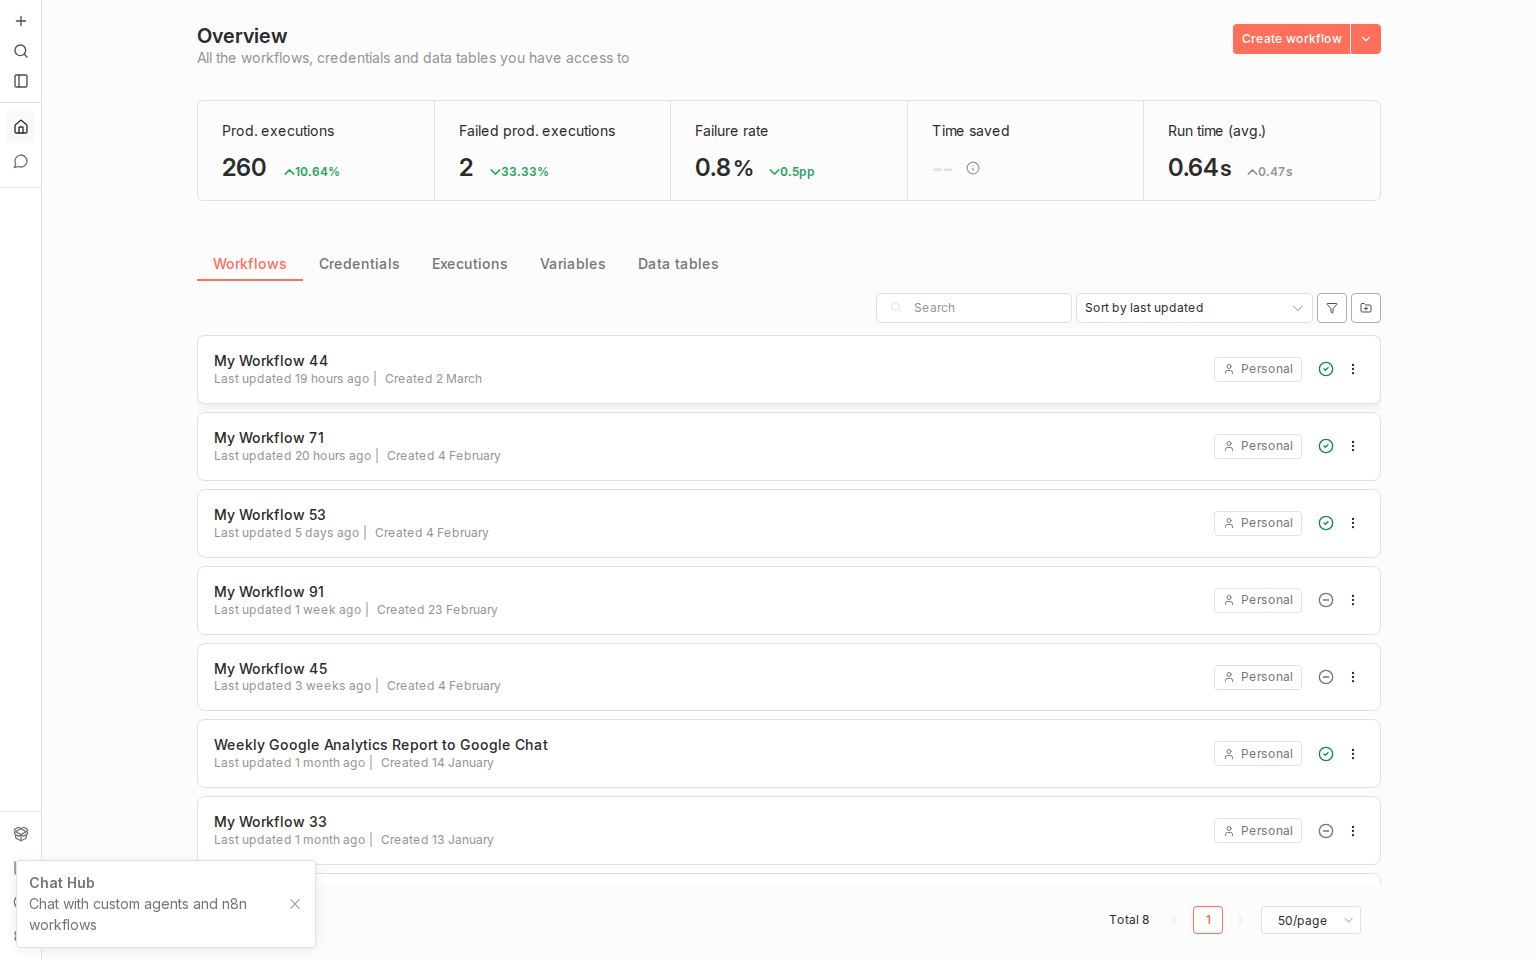
Step 1: Import the Workflow
- Open your n8n instance
- Go to the Overview page where you can see all your workflows
- Click Create workflow (top-right corner)
- Import the workflow JSON using the menu (⋮ → Import from File)
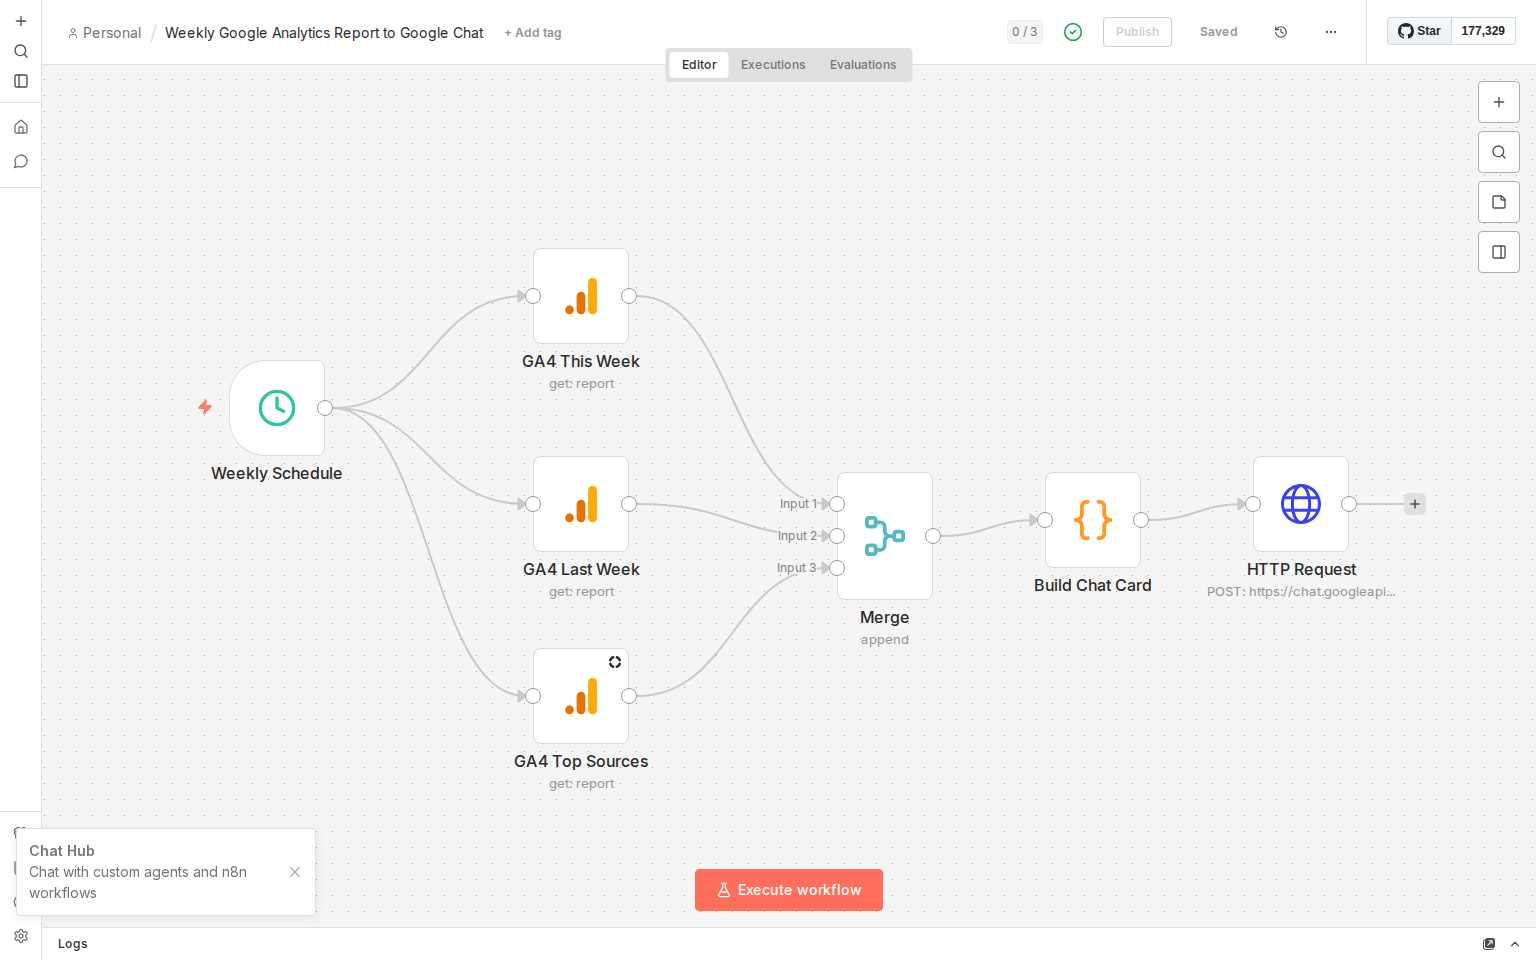
Step 2: The Full Workflow Canvas
After importing, you'll see all 7 nodes laid out on the canvas, connected in order:
Weekly Schedule → GA4 This Week / GA4 Last Week / GA4 Top Sources → Merge → Build Chat Card → HTTP Request
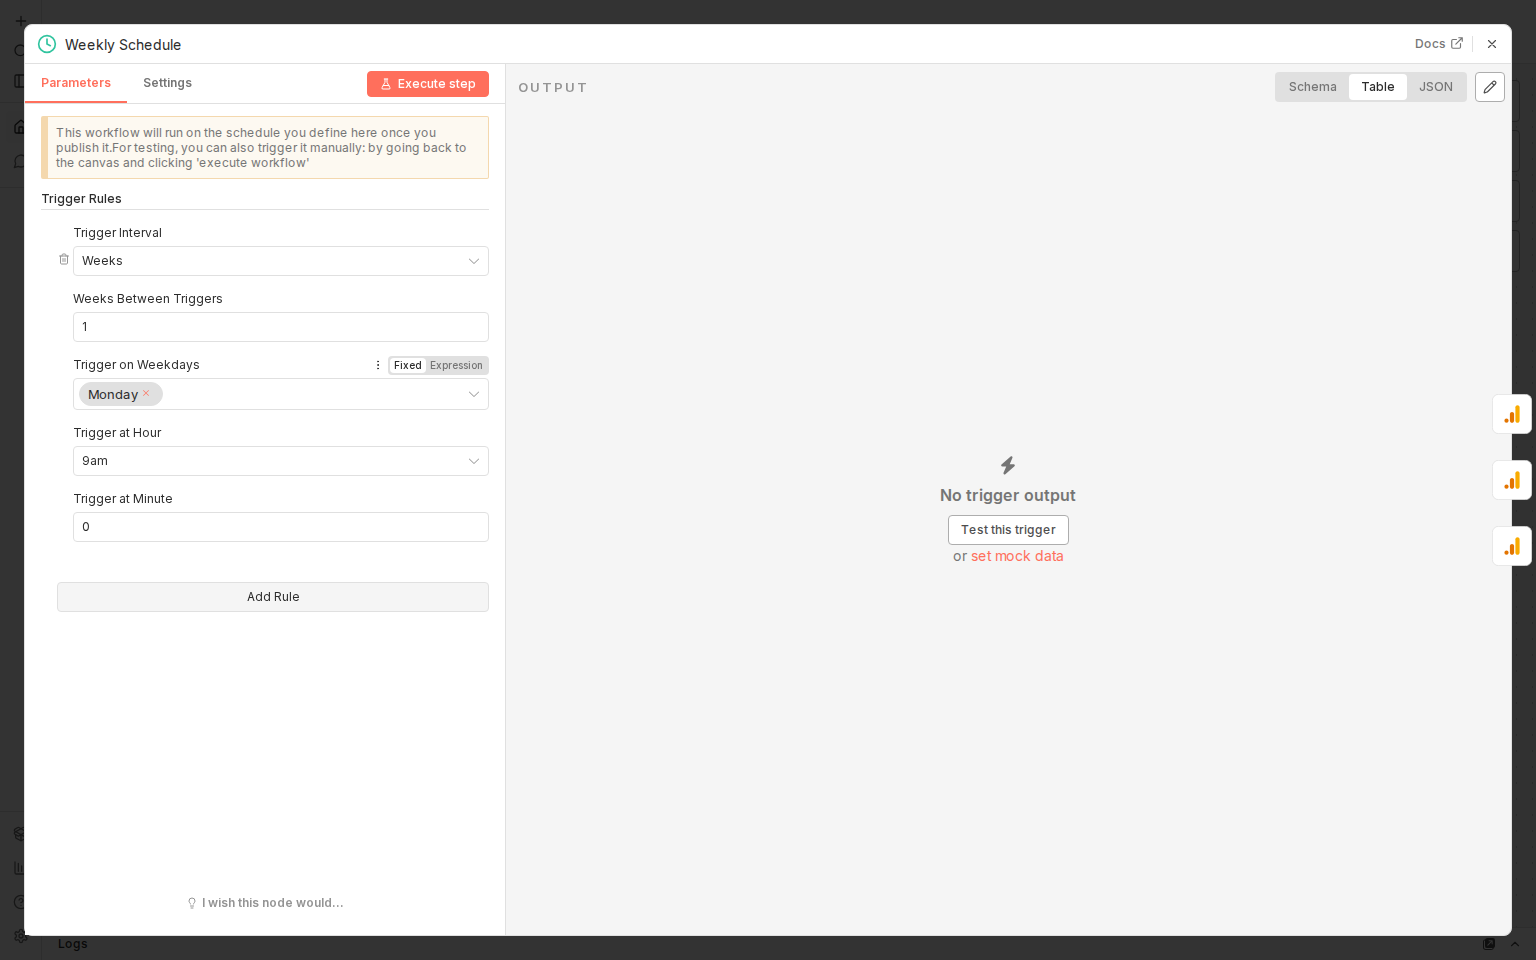
Step 3: Configure the Schedule Trigger
Double-click the Weekly Schedule node to open its settings. This node controls when the workflow runs:
- Trigger Interval: Weeks
- Weeks Between Triggers: 1
- Trigger on Weekdays: Monday
- Trigger at Hour: 9am
- Trigger at Minute: 0
You can adjust these to suit your needs. Change the day, time, or frequency.
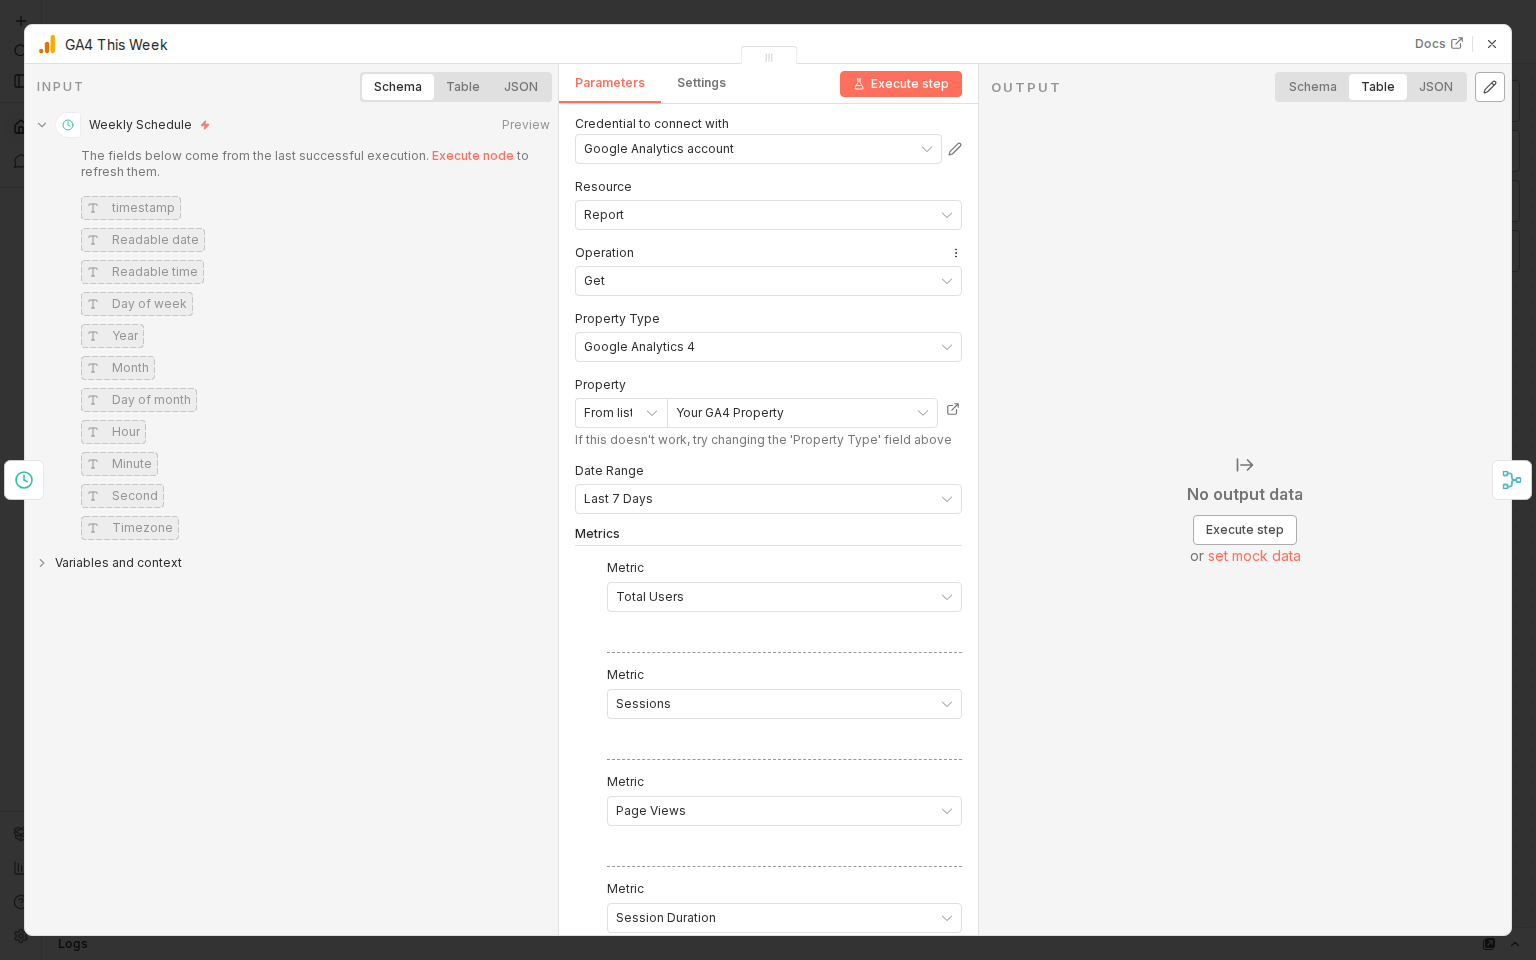
Step 4: GA4 This Week (Current Period) Metrics
Double-click GA4 This Week to see its configuration. This node fetches your current week's analytics:
- Credential: Your Google Analytics OAuth2 account
- Resource: Report
- Operation: Get
- Property Type: Google Analytics 4
- Property: Select your GA4 property from the dropdown
- Date Range: Last 7 Days
- Metrics: Total Users, Sessions, Page Views, Session Duration
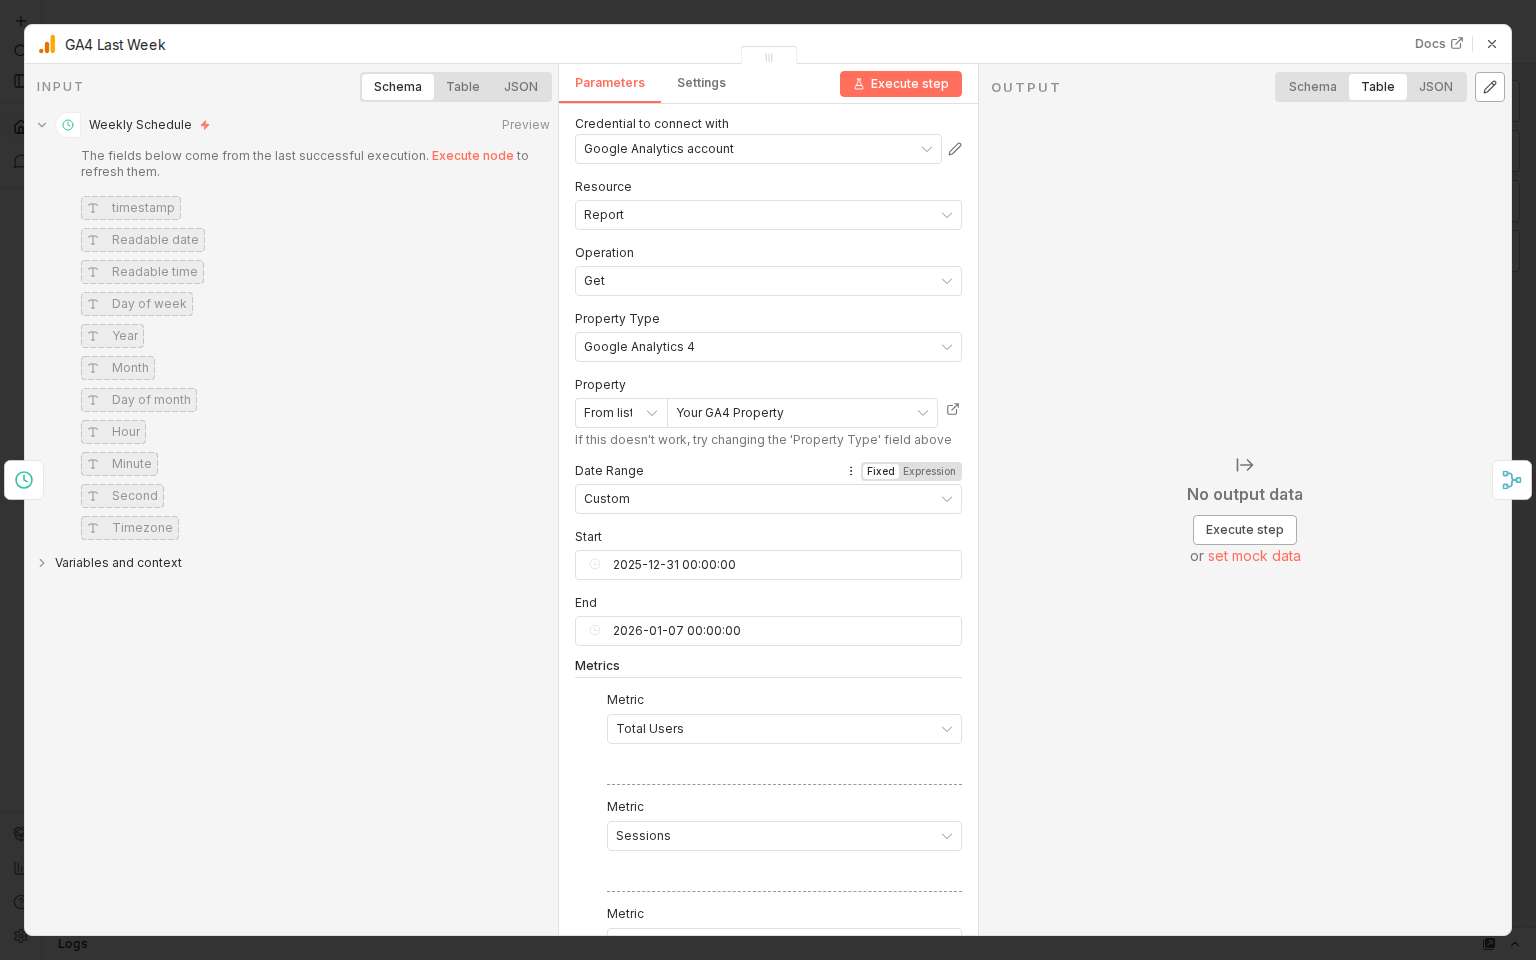
Step 5: GA4 Last Week (Previous Period) for Comparison
The GA4 Last Week node is nearly identical but fetches the previous week's data so the Code node can calculate percentage changes.
Key differences:
- Date Range: Custom (set to the 7-day window before "this week")
- Start / End: Dynamically calculated to cover the previous 7-day period
- Metrics: Same as GA4 This Week: Total Users, Sessions, etc.
This gives you the baseline to compare against.
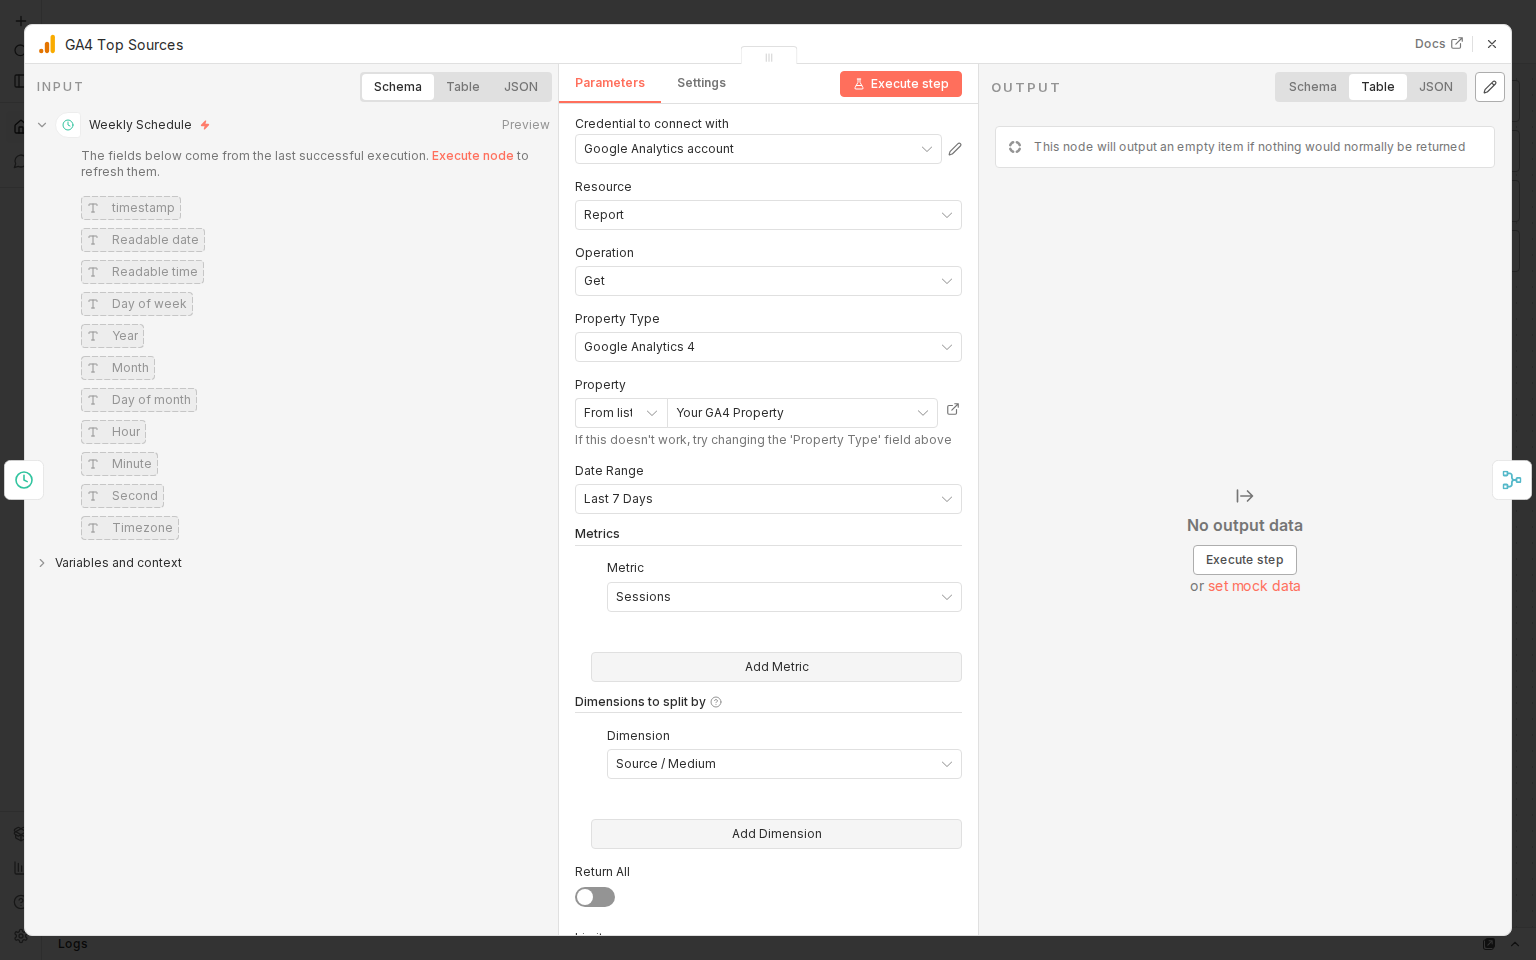
Step 6: GA4 Top Sources: Where Traffic Comes From
The GA4 Top Sources node adds context by showing where your visitors are coming from.
- Date Range: Last 7 Days
- Metric: Sessions
- Dimension: Source / Medium (e.g., "google / organic", "direct / none")
- Return All: Off (limited to top results)
- Sorted descending by session count
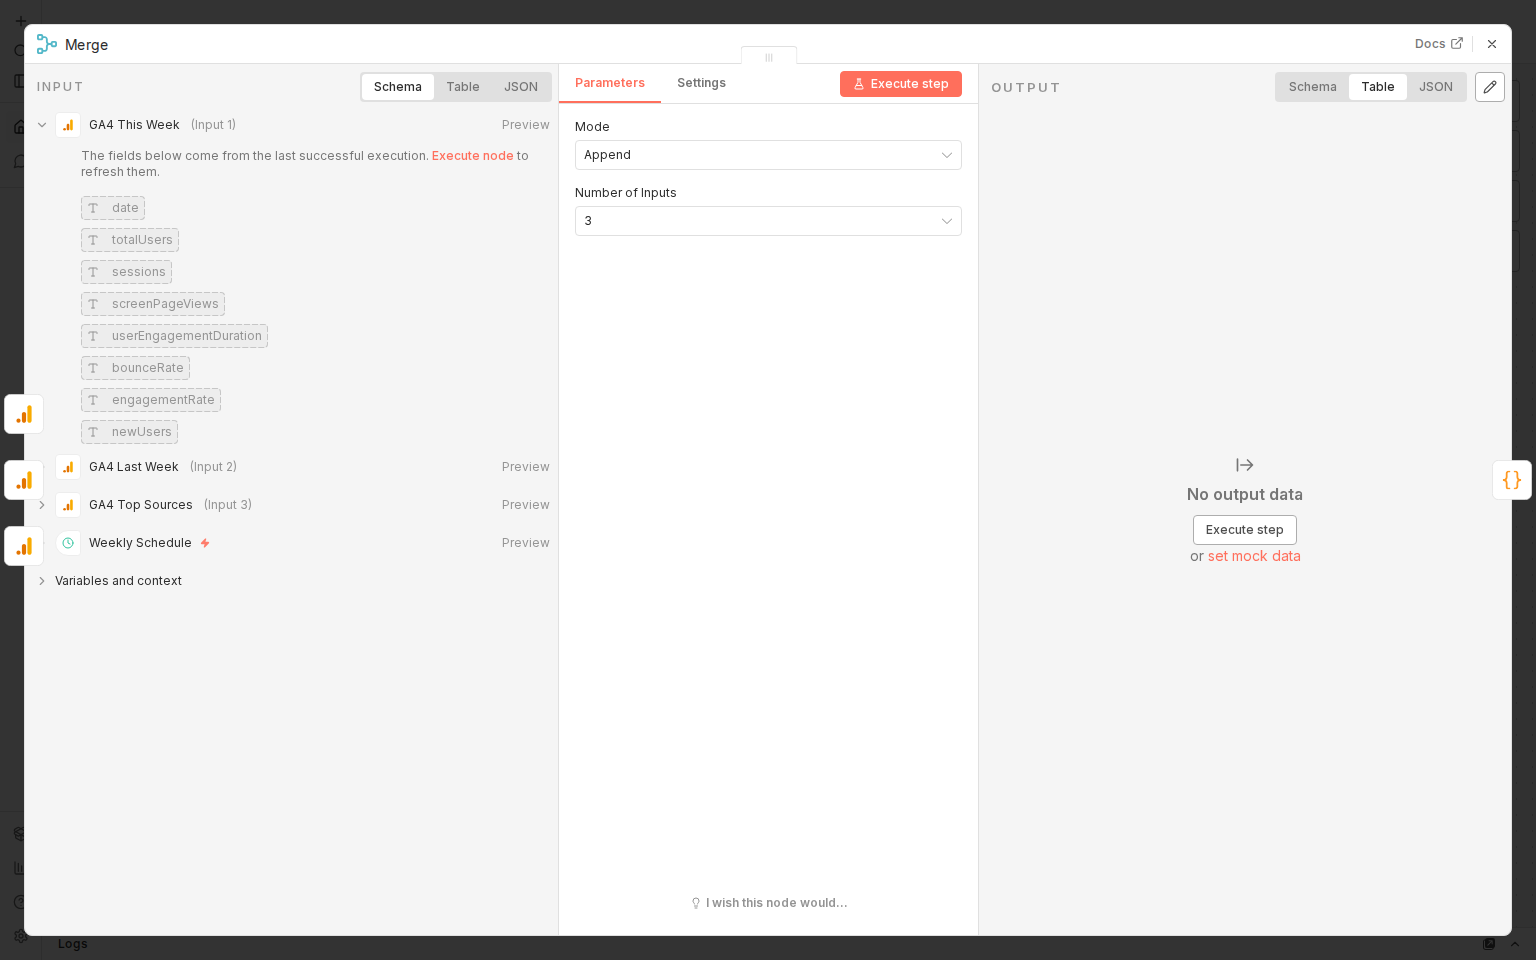
Step 7: The Merge Node: Combining Data Streams
Since the three GA4 nodes run in parallel, the Merge node combines their outputs into a single data stream for the Code node.
- Mode: Append
- Number of Inputs: 3 (one for each GA4 node)
The left panel shows all three inputs: GA4 This Week (Input 1), GA4 Last Week (Input 2), GA4 Top Sources (Input 3).
Step 8: Build Chat Card (The JavaScript Engine)
This is where the magic happens. The Build Chat Card node is a Code node running JavaScript that:
- Pulls data from all three GA4 nodes using
$('GA4 This Week').all() - Aggregates daily data into weekly totals (users, sessions, page views)
- Calculates weighted averages for rates (bounce rate, engagement rate)
- Computes week-over-week percentage changes
- Builds a Google Chat Card V2 JSON structure with an overview section, engagement section, and top traffic sources
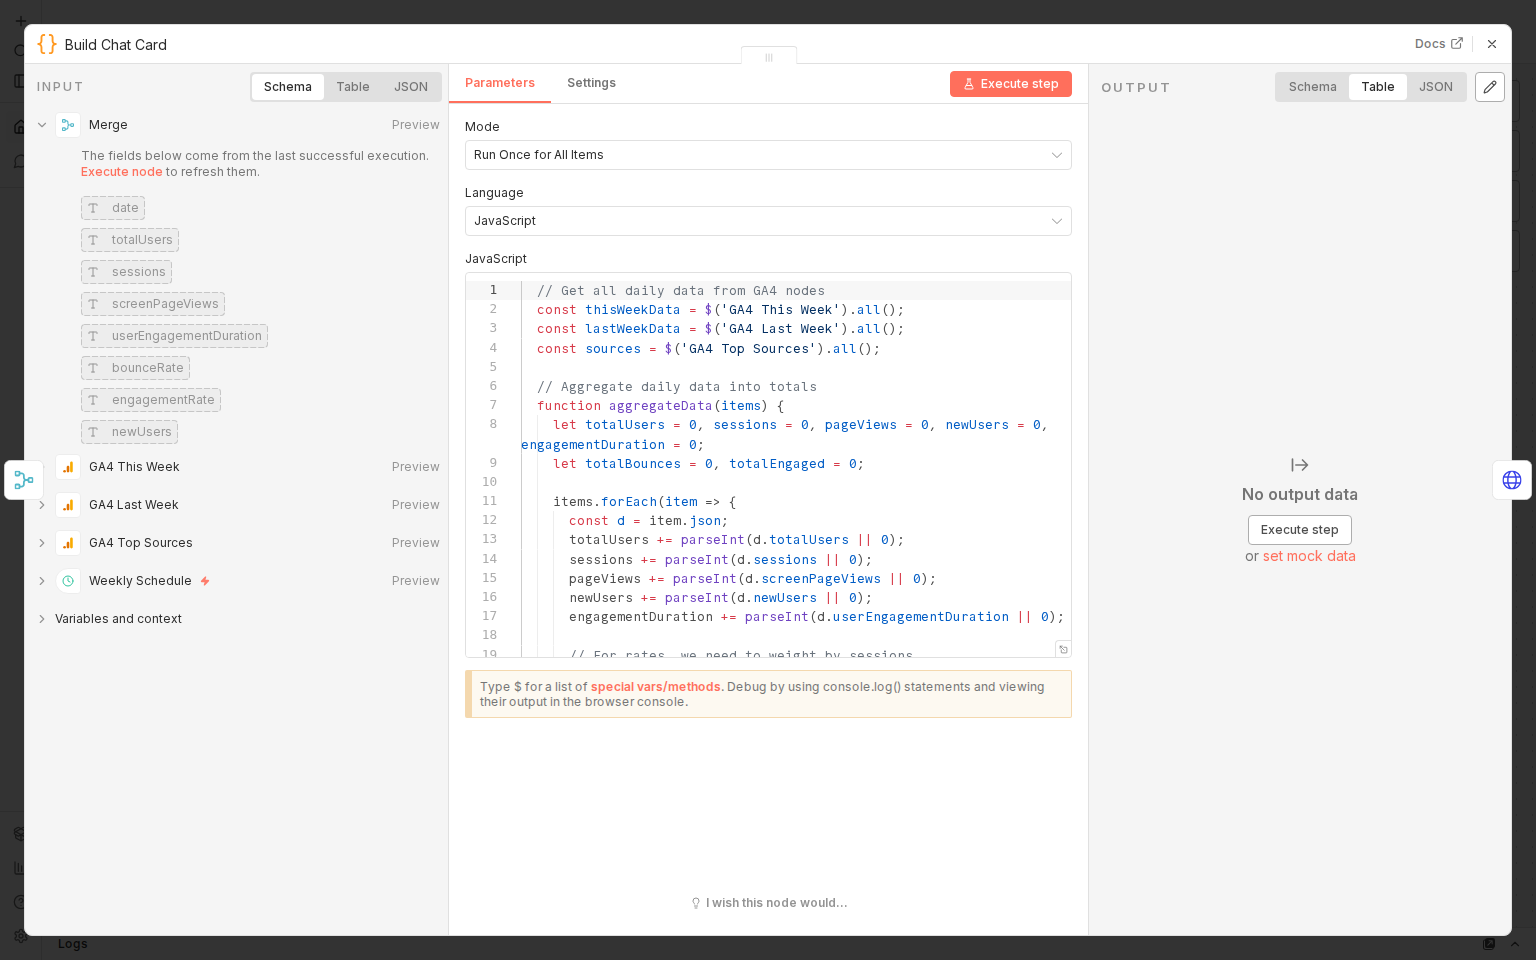
The JavaScript uses n8n's $() function to reference data from other nodes by name. It calculates percentage change with a simple helper function, formats numbers with toLocaleString(), and outputs the entire card as a single JSON object that the HTTP Request node sends directly to the Google Chat API.
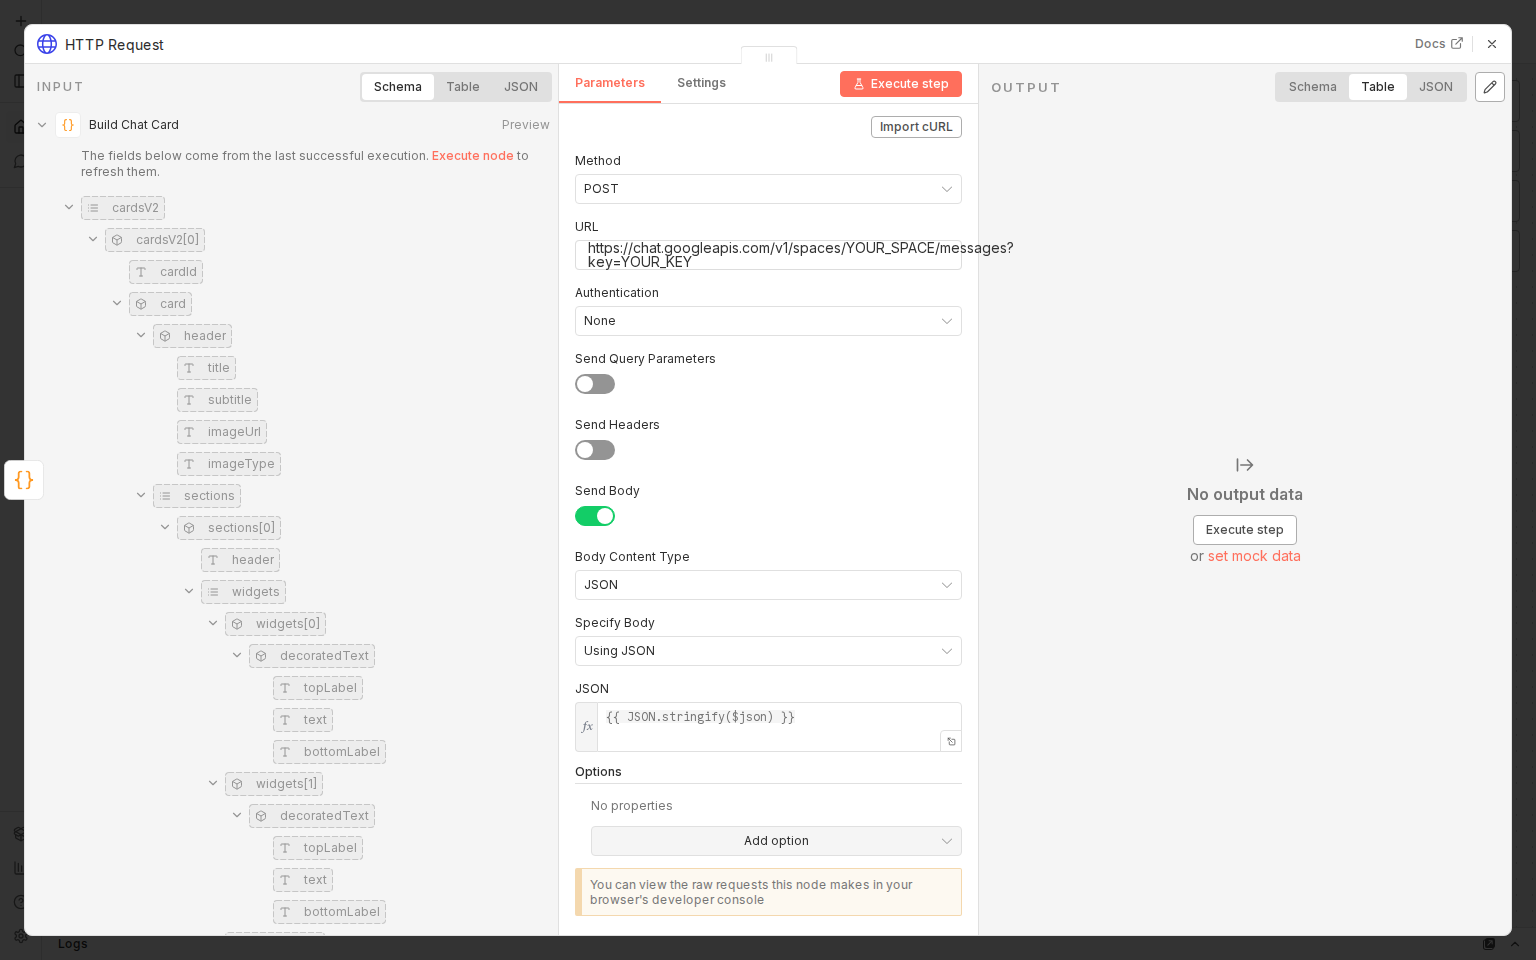
Step 9: HTTP Request (Posting to Google Chat)
The final node sends the formatted card to Google Chat using a webhook URL.
- Method: POST
- URL: Your Google Chat space webhook URL
- Body Content Type: JSON
- JSON Body:
{{ JSON.stringify($json) }}, which passes the card structure built by the Code node
How to get your Google Chat webhook URL
- Open Google Chat
- Go to the space where you want reports posted
- Click the space name → Apps & Integrations → Webhooks
- Click Create webhook, give it a name, and copy the URL
- Paste it into the URL field in n8n
Step 10: Activate the Workflow
Once everything is configured:
- Click Execute workflow (bottom center) to test it manually
- Check your Google Chat space. You should see the analytics card appear
- When satisfied, click Publish (top-right) to make it live
The workflow will now run automatically every Monday at 9 AM.

The End Result
Every Monday morning, your Google Chat space will receive a rich card that looks something like this:
┌──────────────────────────────────────┐
│  Weekly Analytics Report             │
│  Feb 24 - Mar 2, 2026               │
│──────────────────────────────────────│
│  OVERVIEW                            │
│  Active Users    1,234    +12.5%     │
│  Sessions        2,345    -2.1%      │
│  Page Views      5,678    +15.7%     │
│──────────────────────────────────────│
│  ENGAGEMENT                          │
│  Bounce Rate     42.3%              │
│  Engagement Rate 57.7%              │
│──────────────────────────────────────│
│  TOP TRAFFIC SOURCES                 │
│  1. google / organic    890 sessions │
│  2. direct / none       456 sessions │
│  3. twitter / social    234 sessions │
└──────────────────────────────────────┘
No more manual reporting. No more Monday morning spreadsheet pulls. Just automate it and move on with your week.